003 Data Visualization

Would Faith Hill Still Be a Hit?

Exploring how popular music has evolved in the streaming era through data visualization

Timeline 10 weeks, Fall 2024
Role Data Designer, Developer
Course Data Visualization, Parsons
Tools D3.js, Chart.js, Python, Spotify API

Project Overview

In 2000, Faith Hill's "Breathe" dominated the Billboard Hot 100. But would it still chart in 2024's streaming-first landscape? This project uses 24 years of Billboard data and Spotify audio features to explore how hits have transformed.

I analyzed tempo, length, loudness, energy, and danceability across nearly 2,400 year-end chart entries to understand how listening habits shifted from radio to algorithmic playlists. The result is an interactive narrative that reveals how platform economics and cultural expectations have fundamentally reshaped what "popular music" sounds like.

This isn't just about one song—it's about interrogating invisible platform logics that shape culture. Every visualization decision, from color to pacing, was designed to make complex data feel personal and culturally relevant.

Project Link

View Live Project →

Key Metrics

2,400+ songs analyzed
24 years of Billboard data
8 audio features tracked

The Question

Would Faith Hill's biggest hit still be a hit today?

When "Breathe" topped the charts in 2000, radio airplay was king. Songs had room to build, ballads could breathe. Today's landscape is fundamentally different: streaming platforms favor quick hooks, algorithms reward energy and danceability, and listeners skip within seconds if a song doesn't grab them immediately.

This question sits at the intersection of nostalgia, technology, and cultural change. By comparing the sonic DNA of early 2000s hits against today's chart-toppers, I wanted to understand whether the music itself has changed, or if we've simply trained ourselves to want something different.

The question matters because it reveals how invisible platform logics shape culture. Every time Spotify's algorithm decides what plays next, every time a producer masters a track to grab attention in 15 seconds, every time a songwriter hits that 3-minute sweet spot—these aren't just creative decisions. They're responses to a technological ecosystem that has redefined what "popular" means.

Data & Methodology

Data Sources

  • Billboard Year-End Hot 100 (2000–2023) — 2,400 songs that defined nearly two and a half decades of popular music
  • Spotify Web API — Audio features including tempo (BPM), energy, danceability, loudness (dB), valence, acousticness, and duration for each track
  • Manual verification — Cross-referenced naming conventions and artist variations between Billboard and Spotify databases to ensure data integrity

Technical Approach

Python Data Pipeline

Used Python and Pandas to scrape Billboard data, authenticate with Spotify API, and merge datasets. Cleaned inconsistencies and standardized formats for 2,400+ tracks.

D3.js & Chart.js

Built custom line charts, scatter plots, and radar charts to visualize trends. D3 handled complex data binding while Chart.js provided smooth animations.

Narrative Design

Structured as a scrolling story with progressive disclosure. Each chapter reveals one insight at a time, building toward a comprehensive understanding of musical evolution.

Responsive Layout

Mobile-first CSS with custom breakpoints. Charts adapt to screen size while maintaining readability and visual hierarchy across devices.

Design Philosophy

Visual Language

I wanted readers to feel like they're following a thread of curiosity, not reading a research paper. The color palette reflects temporal tension: warm nostalgic tones for early 2000s data, cooler saturated colors for the streaming era. This visual contrast reinforces cultural shift without being heavy-handed.

Narrative Pacing

Rather than overwhelming visitors with all data at once, I structured the experience as a scrolling narrative. You encounter one insight at a time—tempo shifts, then song length compression, then loudness normalization—building cumulative understanding. Each section answers one specific question before moving to the next.

Interaction Philosophy

Interaction is minimal but purposeful. Hovering reveals specific data points, but I avoided overly complex controls. The goal was clarity and narrative flow, not feature bloat. Visualizations communicate at a glance, with layered detail for those who want to dig deeper.

Typography & Hierarchy

Text and visuals work in concert. Clear typographic hierarchy guides the eye, with pull quotes and annotations connecting data points to cultural context. The typography feels editorial—confident and opinionated—while remaining accessible across devices.

Key Findings

The data revealed five major shifts in how popular music sounds:

01

Tempo Drift Downward

Average tempo declined from 120+ BPM in the early 2000s to ~115 BPM today. "Breathe" at 136 BPM is significantly faster than modern hits. This shift aligns with streaming's preference for steady mid-tempo music that works as ambient sound during work or commuting.

02

The 3-Minute Rule

Songs shrank from 4+ minutes in 2000 to ~3:15 by 2023. "Breathe" runs 4:10—outside the modern cluster. Streaming economics incentivize shorter tracks: more songs mean more plays, and listeners skip if hooks don't land immediately. Attention is quantified and monetized per-stream.

03

Loudness Normalization's Legacy

Early 2000s featured dynamic range—quiet verses, explosive choruses. Today's tracks are brick-walled loud (-4 to -5 dB average) despite platform normalization. "Breathe" at -7.2 dB feels spacious by comparison, but that openness reads as dated in today's compressed landscape.

04

Energy and Danceability as Gatekeepers

Modern hits average 0.68 energy and 0.73 danceability. "Breathe" matches energy (0.68) but lags in danceability (0.52). Algorithms favor upbeat, rhythm-forward tracks. Slow burns and emotional crescendos—hallmarks of 2000s pop—are statistically rarer in today's charts.

05

"Breathe" Wouldn't Chart Today

Plotting "Breathe" against 2023 averages reveals it's an outlier on nearly every metric. It's not worse—it's shaped by different listening contexts. A mid-tempo, emotionally patient ballad would likely be labeled "too slow" by today's playlist curators. The verdict: nostalgic rather than contemporary.

Visual Explorations

Average tempo by decade slice chart
Average tempo by decade slice. A quick macro view of how BPM shifts across eras.
Average tempo over time line chart
Average tempo over time. The highlighted point marks “Breathe” (2000).
Average song length over time line chart
Average song length over time. Tracks compress in the streaming era.
Average loudness over time line chart
Average loudness over time. Modern hits sit closer to a louder, more compressed norm.
Average energy and danceability line chart
Energy & danceability. Yearly averages + “Breathe” markers.
Average audio features by genre group bar chart
Genre group comparison. How energy, danceability, and valence cluster by genre.
Musical structure comparison chart
Musical structure comparison. “Breathe” vs an average 2020s hit (normalized).
Emotional and production profile comparison chart
Emotional + production profile. “Breathe” vs recent hits across key features.

Reflection & Learnings

Asking the Right Question

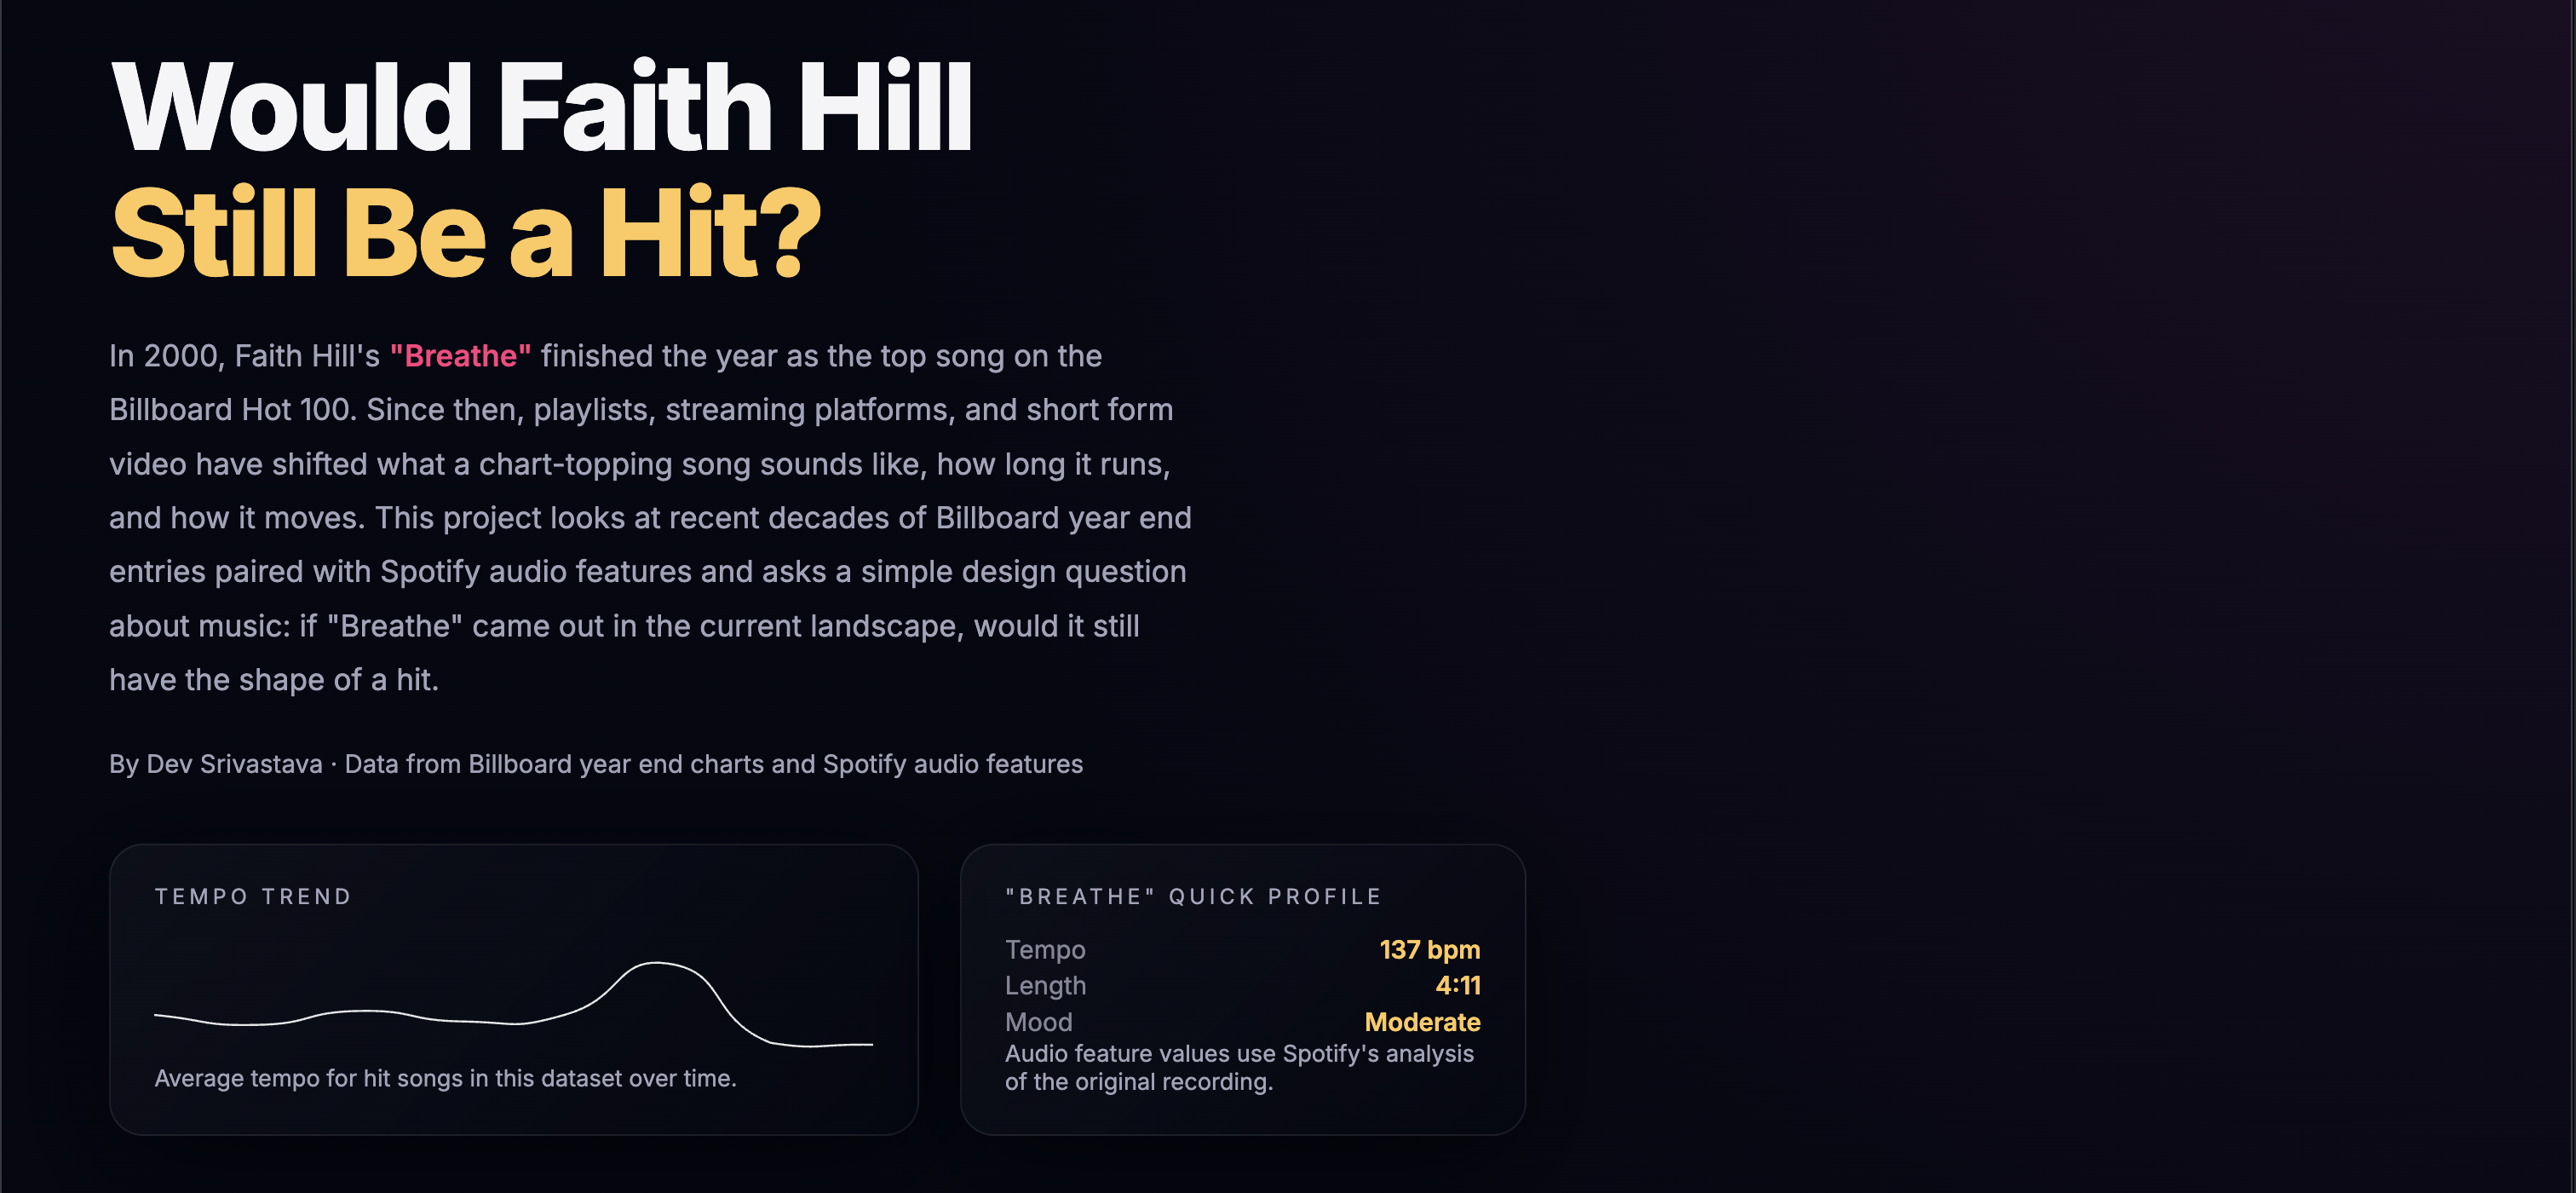
This project taught me that asking the right question is half the work. I could have approached this as a dry analysis of audio features, but framing it around "Breathe"—a specific song from a specific cultural moment—made the data feel personal. It transformed statistics into a story about how we listen, not just what we listen to.

The provocation gave me a narrative anchor. Every visualization decision flowed from that central question. When deciding which metrics to prioritize or how to structure scrolling, I kept asking: Does this answer the question in a way that's true to both data and cultural context?

Data as Translation

I learned that data visualization is an act of translation. Raw numbers don't speak for themselves. My job was shaping the narrative arc—deciding which trends mattered, how to sequence them, when to let visuals do the work. There's tension between showing everything and showing what matters. I had dozens of audio features but not all advanced the story. Learning to edit was as important as technical execution.

Cultural Context is Everything

Good data storytelling requires cultural context. Understanding why loudness increased or why songs shortened means understanding platform economics, listener behavior, industry incentives. The numbers are just the beginning. The story lives in what they reveal about us.

Without context, visualizations would be technically accurate but emotionally hollow. The streaming economy, playlist culture, TikTok's attention compression—all had to be woven into the narrative. The data confirmed patterns we intuitively feel, but seeing it visualized made those patterns undeniable.

What I'd Do Differently

If I revisited this, I'd expand the analysis—comparing genres independently to see if hip-hop and country followed the same trajectory, or layering sentiment analysis to see if what we sing about changed as much as how we sing it. There's also interesting work around global music trends and whether streaming democratized or homogenized popular music across borders.

For now, I'm proud of building something both analytically rigorous and emotionally resonant. That balance—honoring data while telling a human story—is what I'm chasing in all my work.

Next Project Therapy Beagle All Projects