Stock Market Dashboard
Real-Time Stock Tracking and Analysis
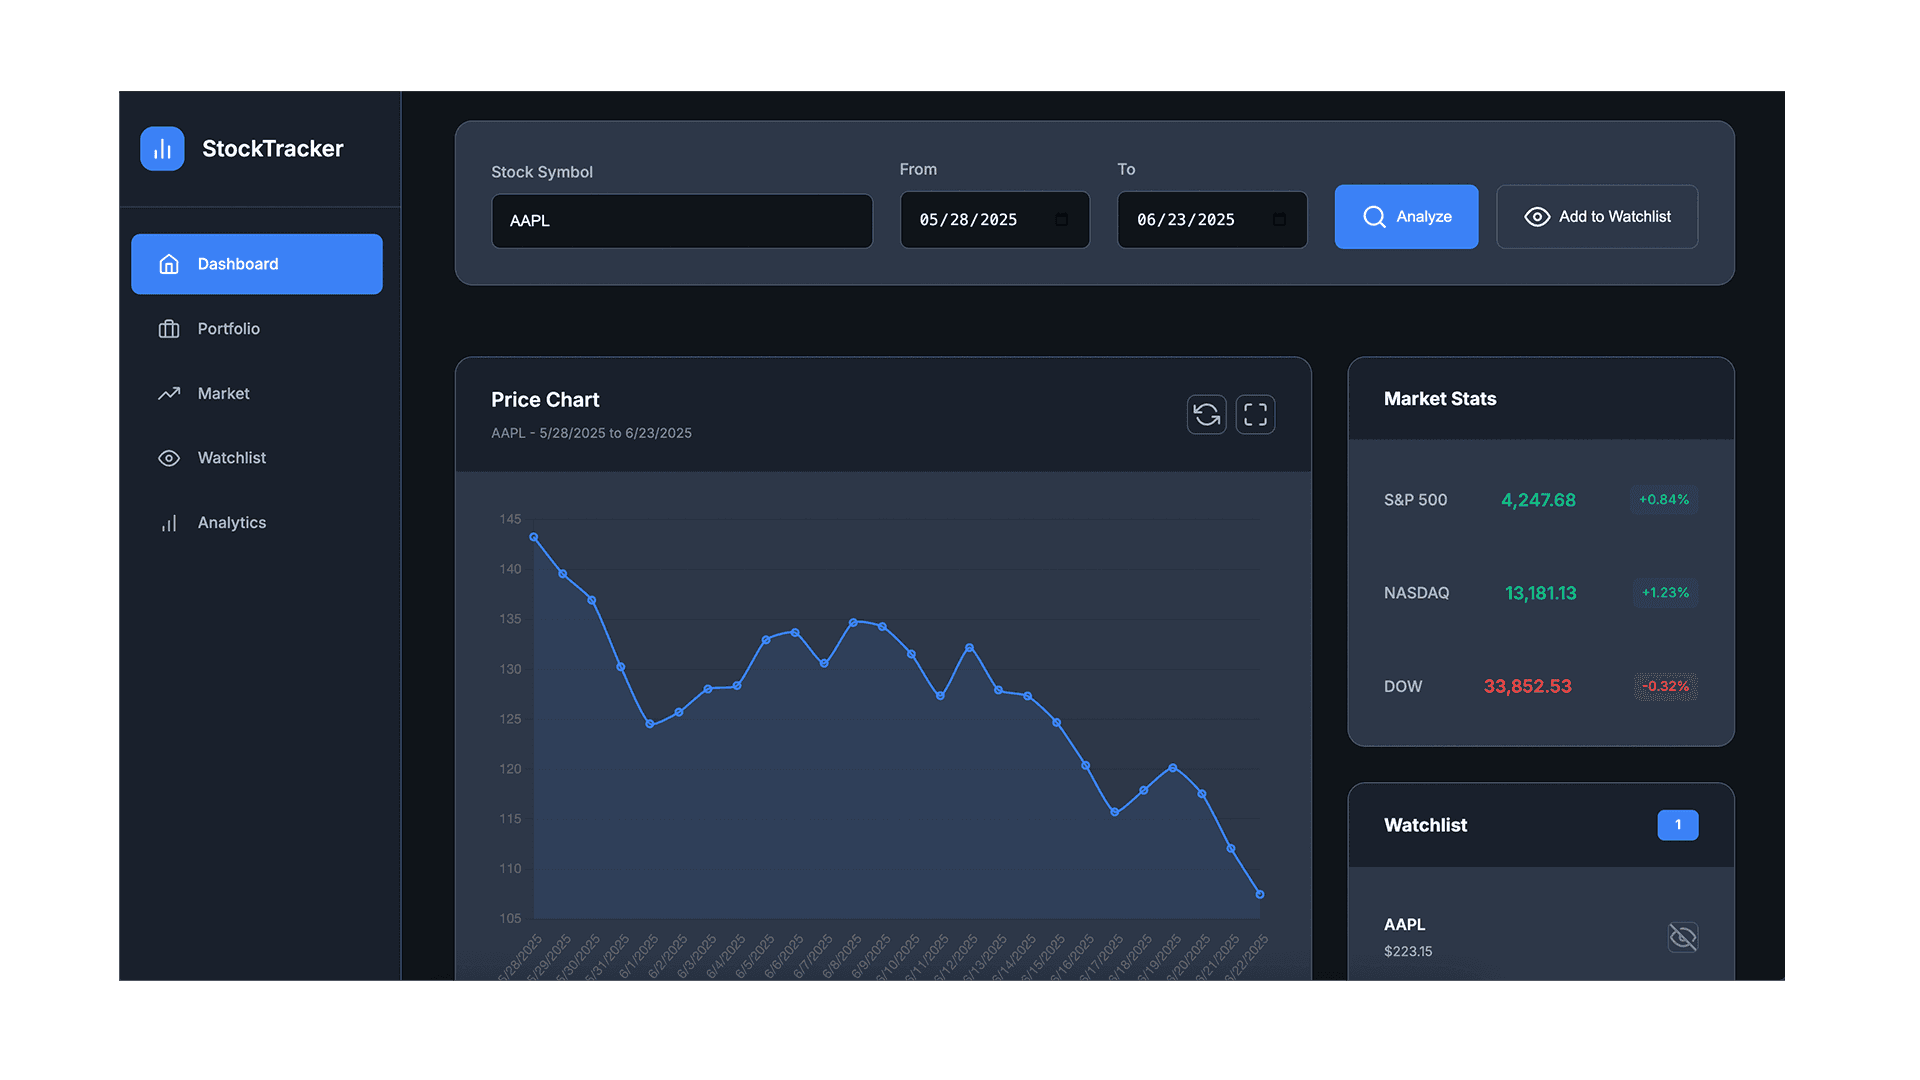
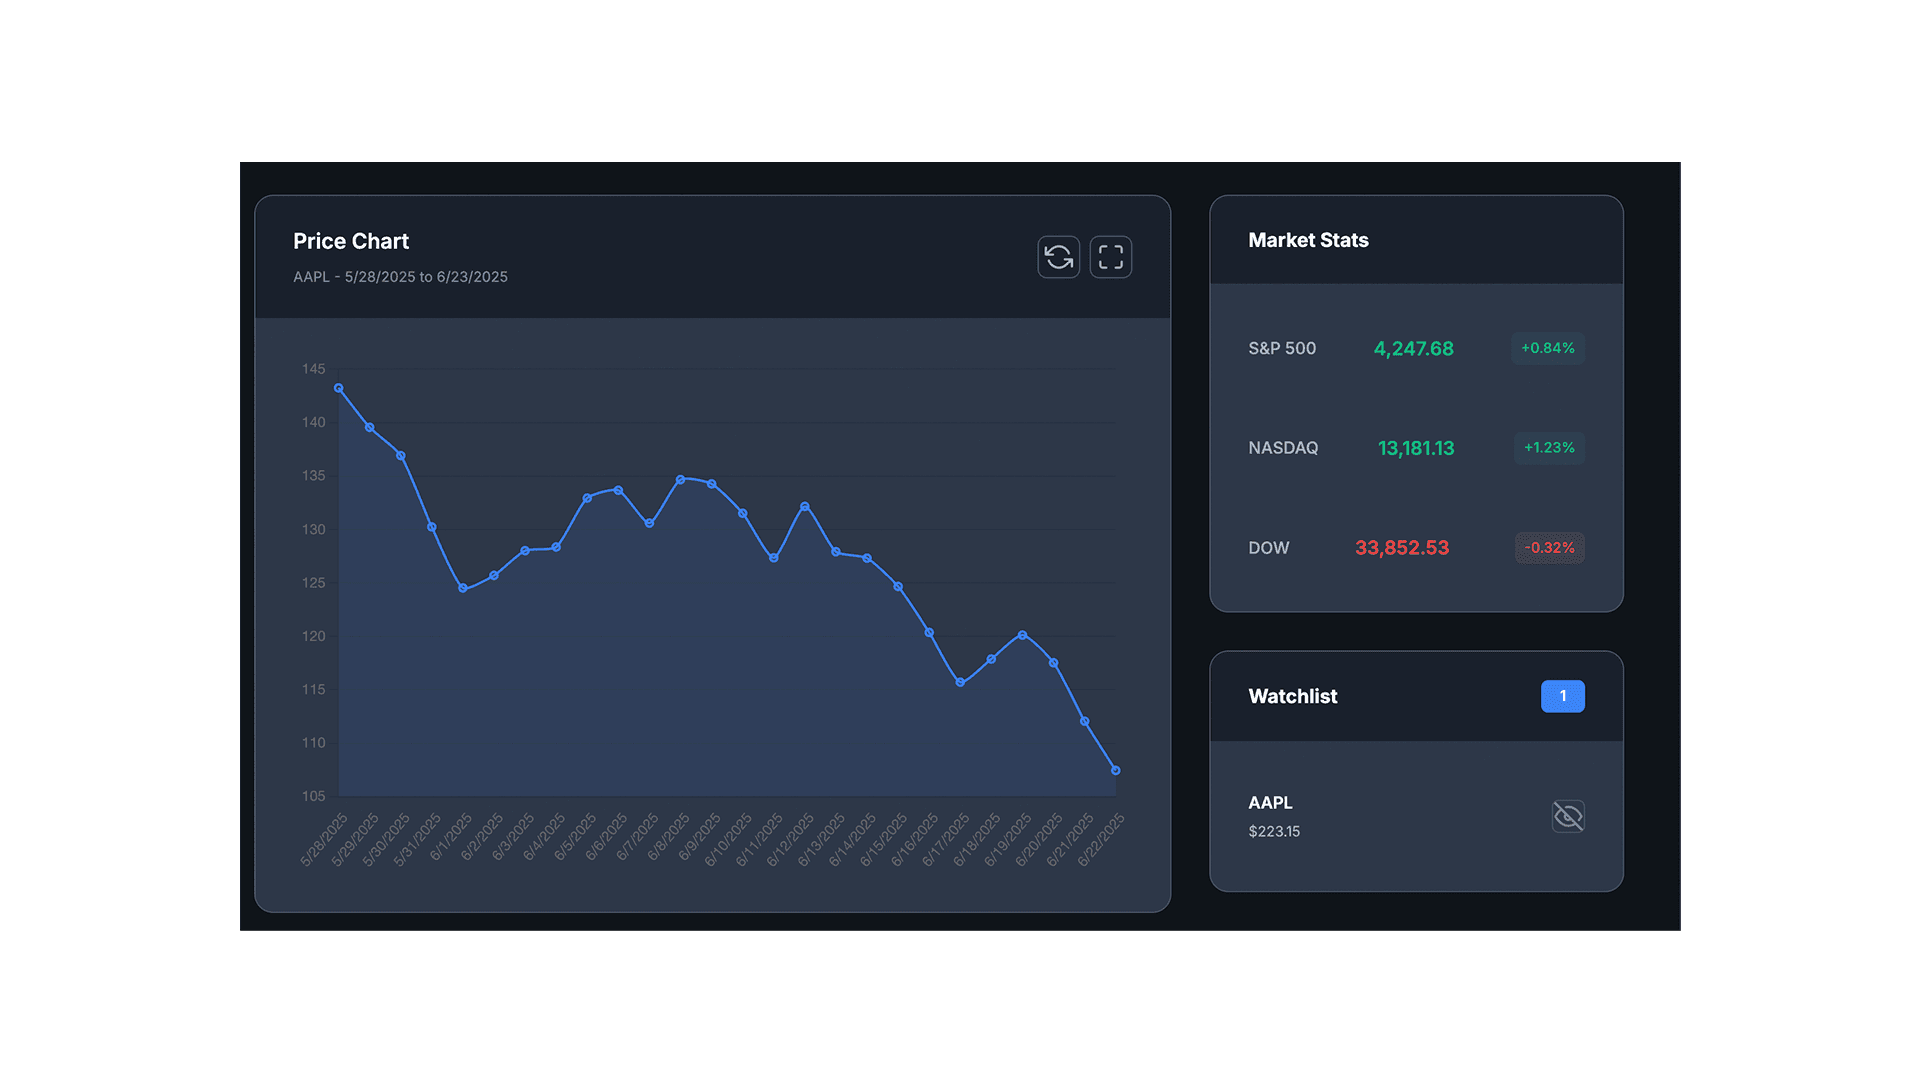
The Stock Market Dashboard is an interactive web application that allows users to track and visualize stock market data effortlessly. It is designed with a user-friendly interface and includes powerful features to enhance the experience of analyzing financial data.
Client
Personal
Services
Visual Design UI & UX Design
Industries
Finance
Date
January 2024
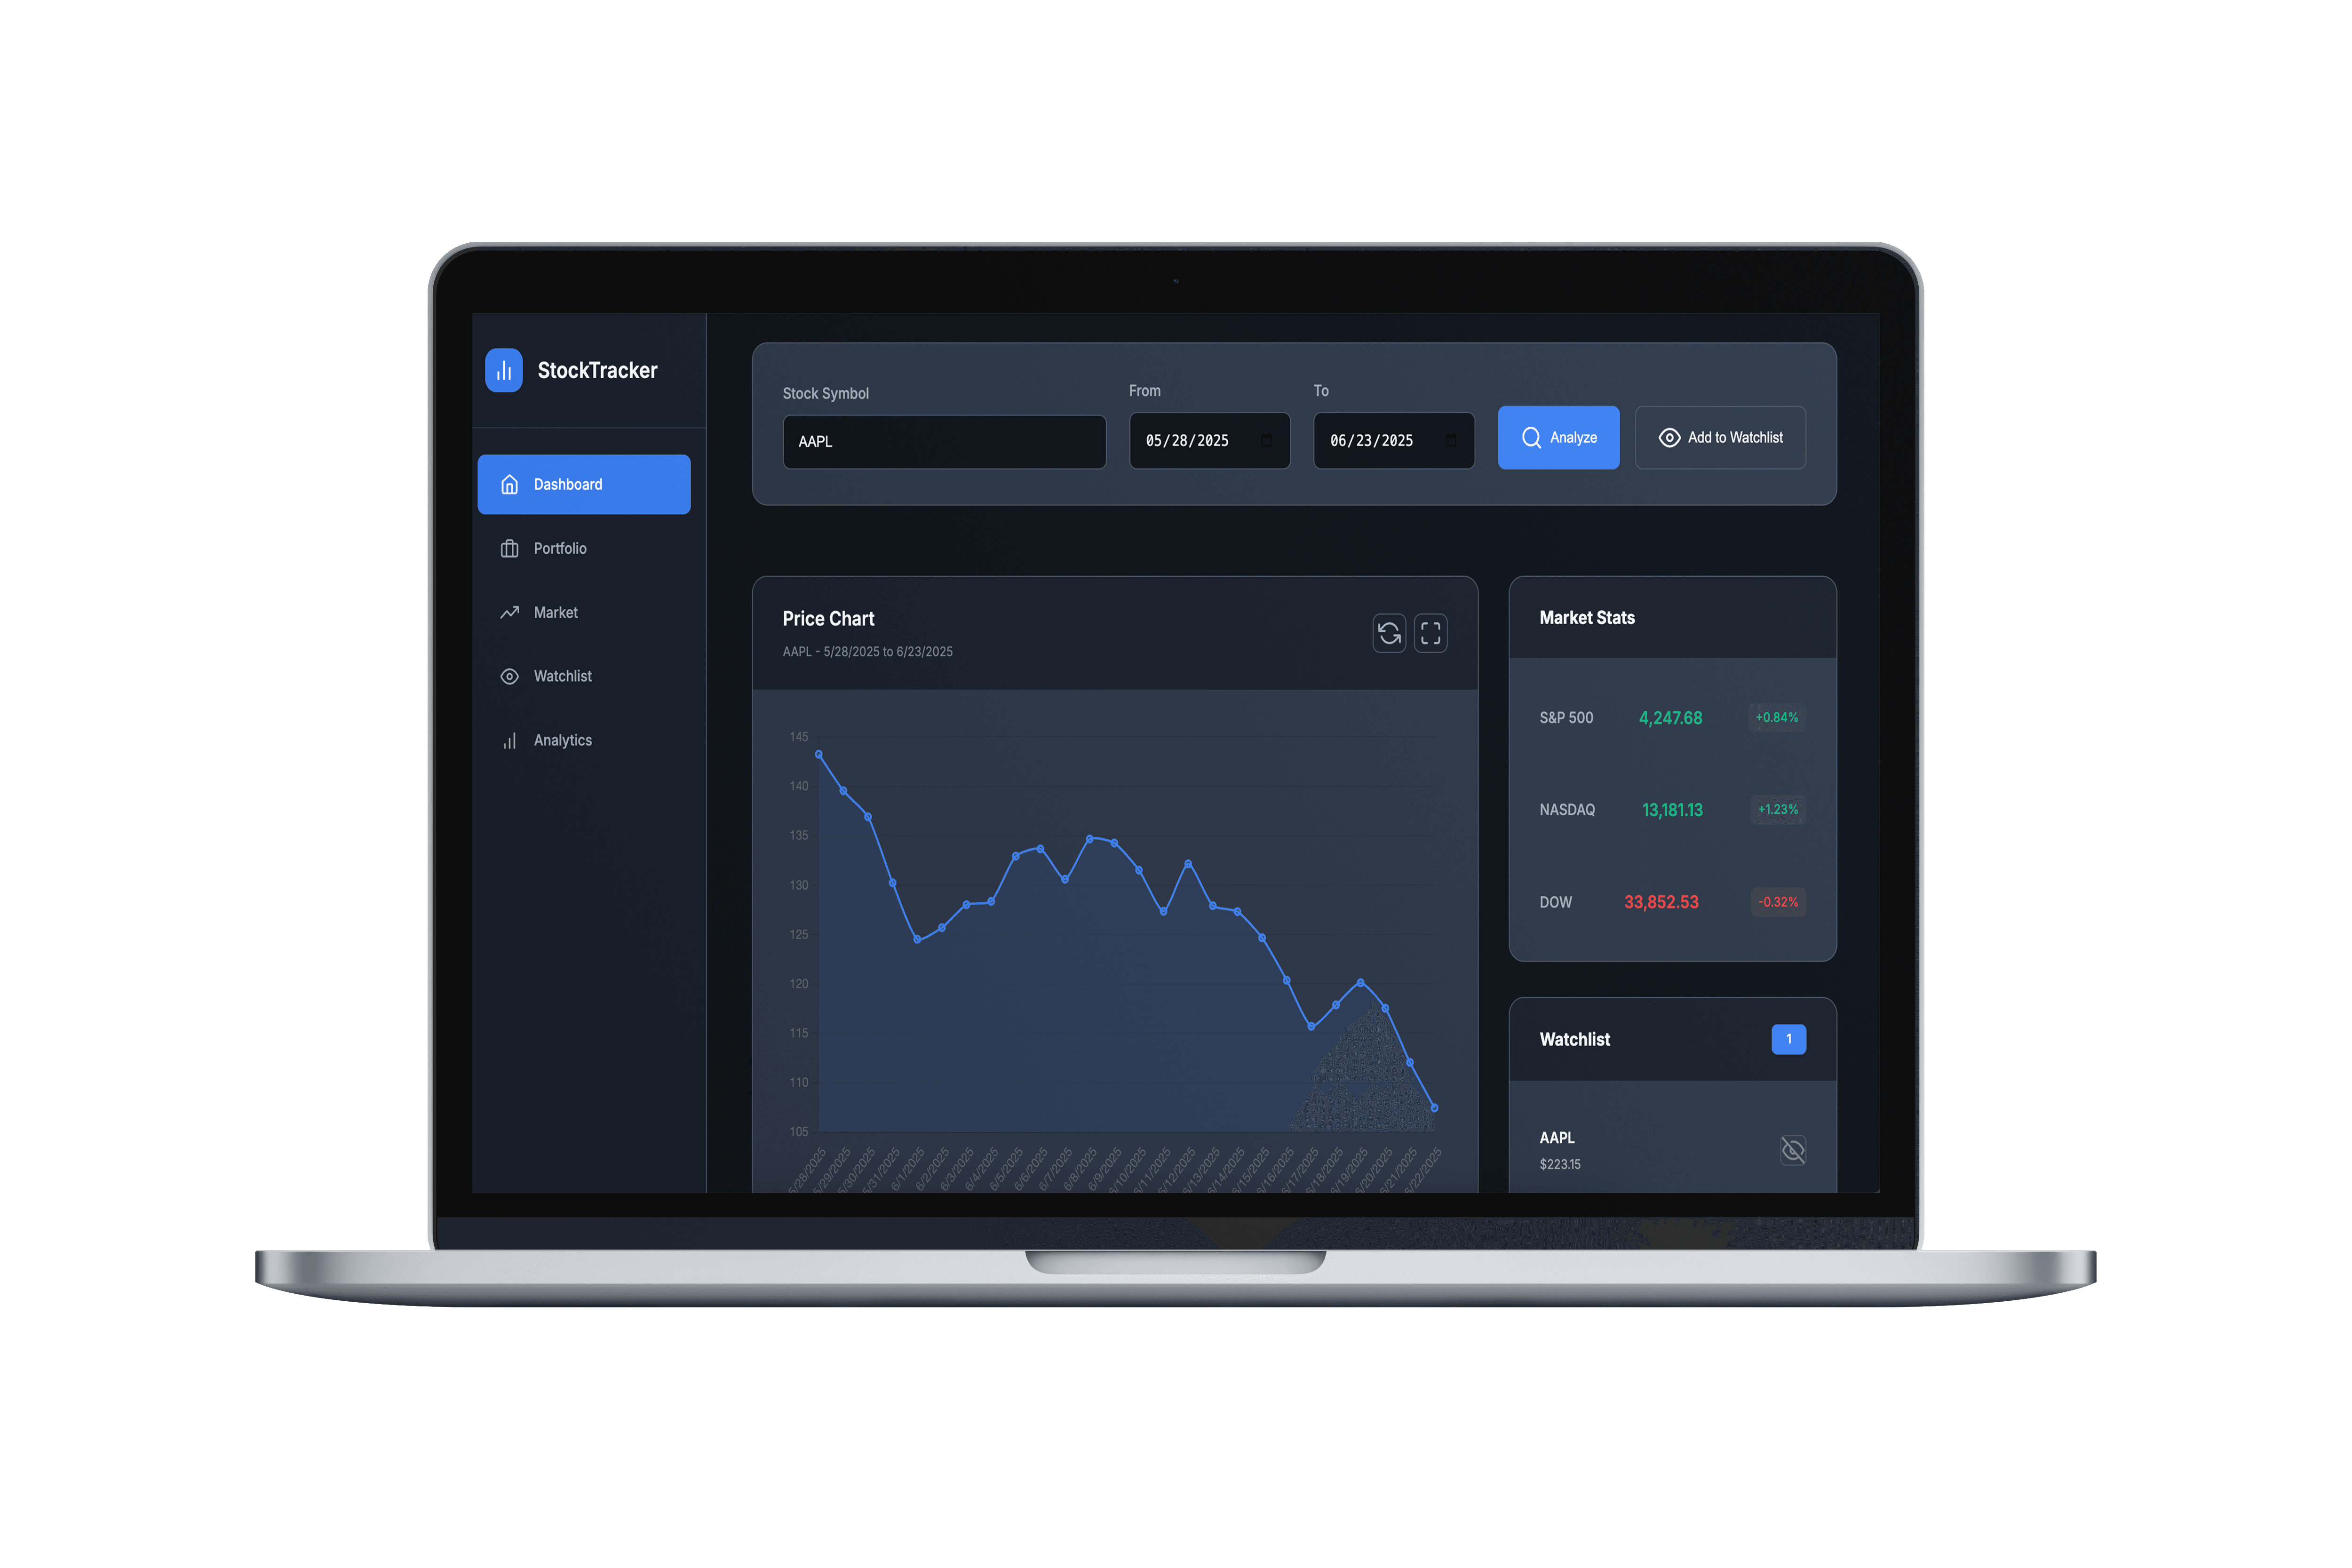
Process & Solution 1. Researched how investors track stock data and what key metrics they focus on. 2.Designed a clean and intuitive UI for easy stock tracking. 3. Used real-time API data to update stock prices dynamically. 4.Built interactive charts to visualize trends and performance.
Impact 1. Improved my skills in data visualization and real-time API integration. 2. Created a dashboard that helped me and others track stocks efficiently. 3. Received positive feedback from peers who found it useful for understanding market trends.